May 2019 - Market Research and Commentary
Where’s this all going? - Changes in Economic Indicators
We begin with a review of economic conditions facing the consumer, then the research and commentary moves into the conditions facing businesses. Following last months yield-curve inversion, the 10-year yield has regained yield and 10 year yield is now greater than the 3-month. Such a reversal is not surprising and the spread between the two Treasuries is still quite tight.
In other areas of the credit market, interest rates are showing more pronounced trends. For example, consumers are seeing a protracted trend of higher interest rates on Credit Cards and and auto loans. Conversely, mortgage rates have decreased from a recent high in Q4 2018.
For the business, pricing and leverage for M&A and buyout transactions are not showing as clear of a pattern. Given the difficulty in creating a single gauge of the middle-market conditions, the direction the market is opaque. After pulling away from more risky assets (see “Loan Funds Flow” from previous newsletters), the market appears to have hit a new equilibrium.
As more reports on Q1 become available in the coming weeks we’ll be looking out for changes in issuance and delinquency, but by all accounts the market continues to remain fairly bullish.

Chart I - Consumer credit rates on the rise
Interest Rates on consumer credit cards have increased dramatically from 2016 and the interest on auto loans has increased steadily since 2018, proving consumers are still feeling the effects of previous interest rate hikes.

Chart II - Freddie Mac Primary Market Mortgage Survey - April 2019
Conversely, mortgage rates have decreased following a recent high in Q4 2018.

Chart III - Delinquency by Account type as of Year-end 2018
Student Loan delinquency remains elevated, Credit Card payment delinquencies appear to have plateaued and Auto Loan delinquencies remain on the rise. Despite the data being a few months old, one can infer that with higher interest rates on Credit Cards and Auto Loans the delinquency rate on variable interest rate products such as Credit Cards has been on the rise.
Credit Conditions in the Middle Market

Chart IV - LevFin Insights Middle Market Leverage Stats
Chart IV shows a steady if not slightly erratic pattern of the leverage profiles of deals that cleared the market in the 2 year time frame listed. Leverage has hovered around 5.0x for Middle Market transactions tracked in the LevFin data-base with a surprising 6.2x average total leverage multiple for February 2019. Such a multiple might have been due to the fact that fewer deals cleared the market in February while coinciding with few highly levered deals that cleared the market.

Chart V - Leverage has slowly declined
Chart V - GF Data’s database shows a more pronounced trend. Its year-end leverage report shows a decline in total leverage profiles for all transactions in its database (e.g. including M&A, buyouts, etc.). These eight-quarters of data suggest total leverage has found a new equilibrium below 4.0x for M&A and buy-out transactions. The combination of, holding steady, but higher interest rates and increased caution in the market will mean this leverage profile will likely prevail until another factor shifts the market.
Preqin’s Q1 2019 - Private Debt market update gives a great overview of the current trends facing non-bank lenders. While the report is optimistic about the continuation of strong activity in 2019 the bullishness is concentrating in certain parts of the market. Direct lending funds continue to draw the dearth of fundraising dollars and the total funds closed in Q1 2019, a total of 20 with $22 billion raised, is the lowest since 2016.
The charts below provide a glimpse of capital raising activity. The number of funds looking to raise capital continues to increase but the target capital amount is but inching upwards. Dry powder levels have also continue to rise. [Final thought]

Chart VI - Private Debt is seeing a growth in the number of funds but a relative stall in aggregate capital

Chart VII - Available capital to deploy continues to grow
Private equity is mirroring the trends and conditions in private debt. Private equity is becoming an increasingly crowded asset class (Chart VIII) with the number of funds more than doubling since 2016. Total capital raised has decelerated in 2019 reflecting the anecdotes that good deals are hard to come by.
Most surprising in Q1 was the percentage of respondents in the Preqin poll that reported “Other Private Equity” as a strategy (Chart IX). Deducing from the market volatility in Q4 2018, this shift looks like an opportunistic play by investors and fund manages to snatch up portfolio churn or the coming wave of turnarounds in a recessionary environment.
Give the the level of available dry powder (Chart X), its likely that the market will be able to quickly absorb substantial turnover, albeit investors and fund managers do not display too much of a risk-off stance in a downturn. For those looking to generate excess risk adjusted returns, the waiting for more favorable valuations might just be around the corner, although with so much money sitting on the sidelines turnaround or distressed purchases might not be as attractive as in previous cycles.
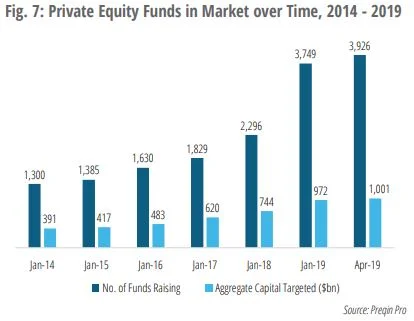
Chart VIII - Private Equity is getting just as crowded as Private Debt

Chart IX - Q1 2019 sees a massive jump in alternative PE strategies, which include turnaround funds
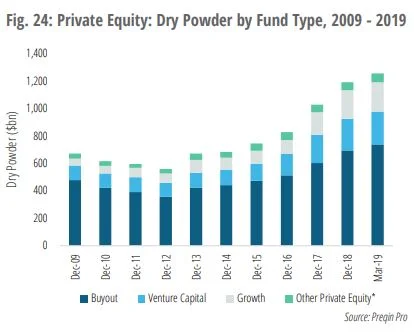
Chart X - Dry Powder continues to build with buyout funds leading the way, clearly still “too many dollars chasing too few deals”.